Bismillah
Having completed the basic analysis (Basic Analysis), we proceed to the advanced analysis (Advanced Analysis). In this article, we examine the principal disassembler and debugger tools employed to analyze binaries, providing a concise and rapid overview. During hands-on application, these tools will be explored in greater depth and detail.
Disassemblers
These tools are used to read a program without executing it (Static Analysis), analogous to reading a map to identify directions and terrain before commencing a journey.
- IDA Free (to be used in the workshop)
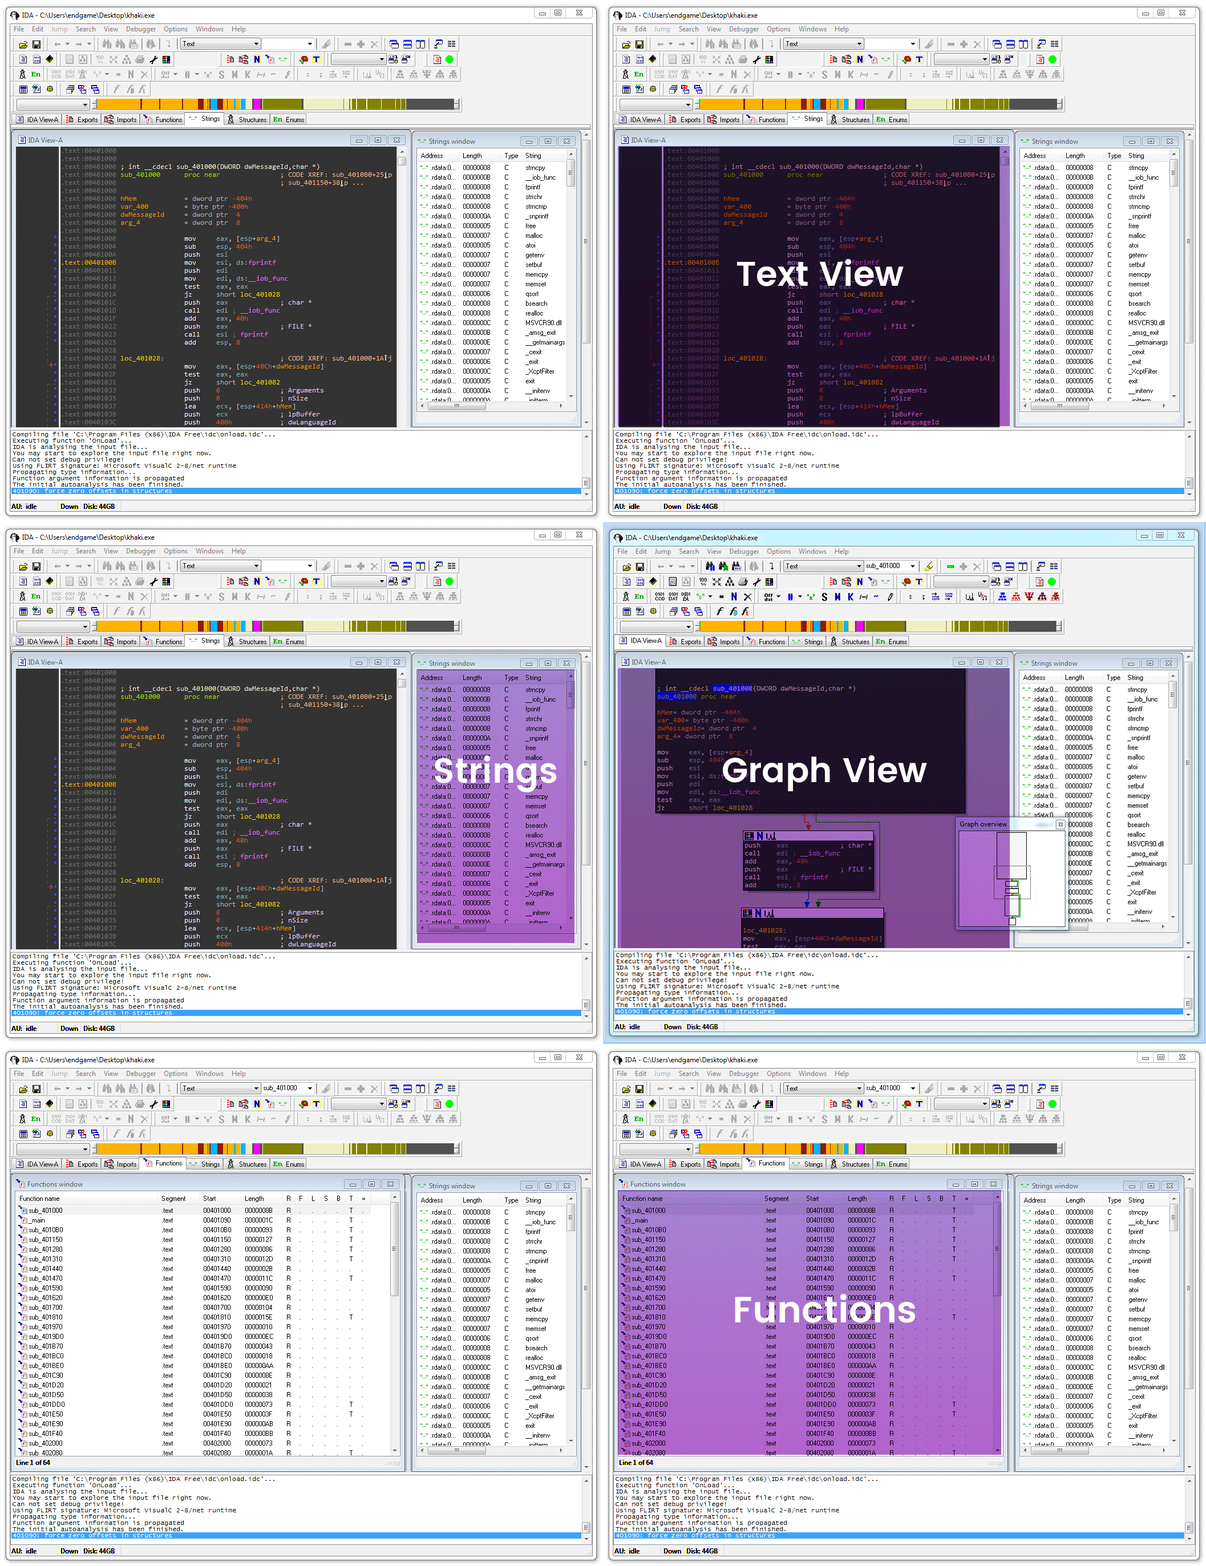 Figure (1): The IDA Free application interface.
Philosophy of Using Both Tools Together:
- IDA (the radar): Its interface offers the best and fastest navigation across functions and graph views (Graph View). It is the tool we begin with to understand “where” we are heading and to grasp the program’s overall structure.
- Ghidra (the deep dive): The free version of IDA imposes limitations, such as lack of support for certain architectures like ARM, and the absence of a Decompiler (converting code to C) for some files. Ghidra, by contrast, provides these powerful features entirely free of charge (Open Source).
Visual Modes
- Graph Mode: Displays control flow as a graph, facilitating the tracking of jumps and programmatic decisions (If/Else, Loops).
- Text Mode: Displays assembly code sequentially and conventionally, from top to bottom.
Advanced Functions
These enable the analyst to navigate to code references, Xrefs (Cross-References), to determine where specific strings or functions are called, and to trace the reverse path back to the entry point (Start Function or Main).
⌨️ IDA Command CheatSheet
| Command (Shortcut) | Action |
|---|---|
| X | Jump to Xref (navigate to cross-references) |
| G | Jump to address (navigate to a specific memory address) |
| SHIFT + ; or : | Enter comment (add a comment to the code) |
Debuggers
- x64dbg (to be used in the workshop)
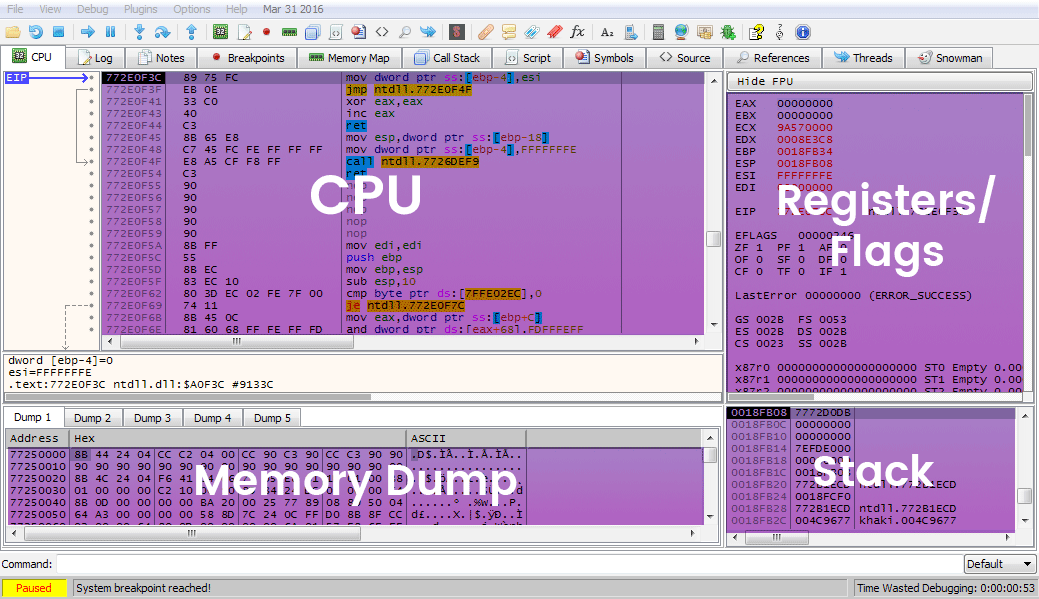 Figure (2): The x64dbg application interface.
These tools are used to conduct deeper analysis by actually executing the program within a controlled environment to observe its hidden behavior, which often does not surface in the disassembler due to obfuscation techniques (Obfuscation).
Execution Control (Logic Manipulation)
These tools allow the analyst to “manipulate” the program’s path in live memory. For example, modifying register (Registers) or flag (Flags) values to bypass certain conditions (Branch Statements) and reach hidden code, or to skip activation verification screens (Cracking).
⌨️ x64dbg Command CheatSheet
| Command (Shortcut) | Action |
|---|---|
| ; | Enter comment (add a comment) |
| F2 | Toggle Breakpoint (set/remove a breakpoint) |
| F7 | Step Into (enter into the function) |
| F8 | Step Over (skip the function and move to the next line) |
| F9 | Run (run the program until the next breakpoint) |
| Space | Edit Instruction (modify the assembly instruction in memory) |
Keyboard Layout for IDA Free & x64dbg
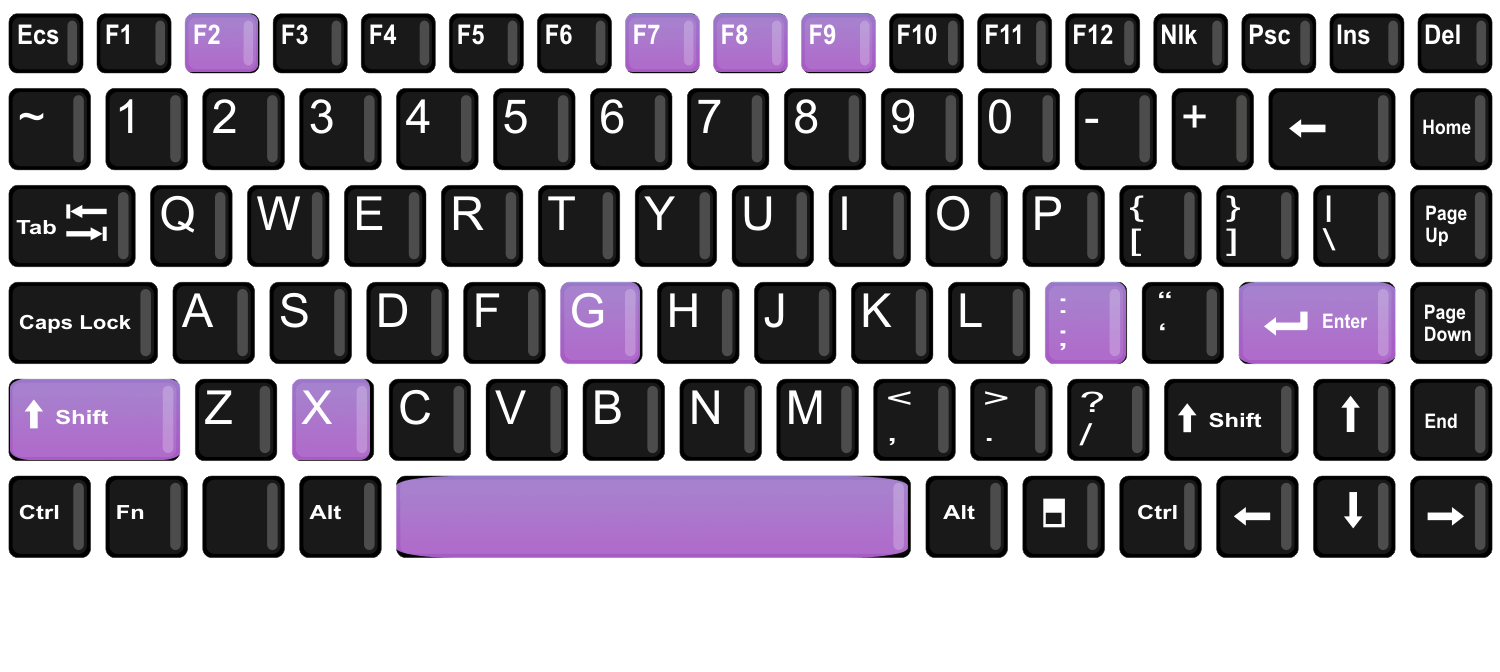 Figure (3): A map of the keys we will continually need to operate during analysis.