Bismillah
In this article, we will solve a simple lab challenge that relies entirely on dynamic analysis using the x64dbg debugger. We assess that the exercise demonstrates how to bypass anti-debugging mechanisms and how to patch the program’s execution flow so that it accepts any key we provide.
Lab environment setup: The executable for this lab can be downloaded from the following link dyn4m1c_cr4ckm3 in the course repository. Archive password: p01nt
1. Reconnaissance
To begin, we open a command prompt (CMD) and run the program to observe its initial output.
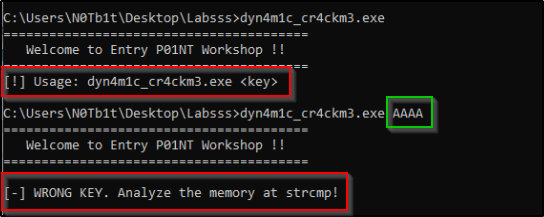 Figure (1)
We observe that the program requires an argument (key) to operate.
When inspecting the strings section using the PE-Bear tool, we note an interesting message indicating debugger detection.
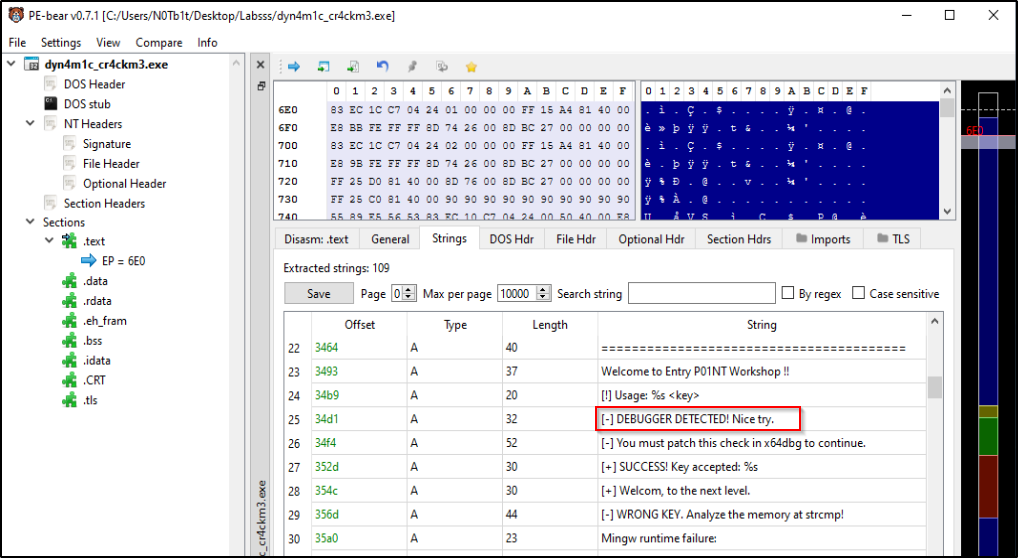 Figure (2)
This clearly indicates that a protection routine exists within the code that checks whether the program is running under a debugging environment. By examining the import functions (Imports), we identify the following function:
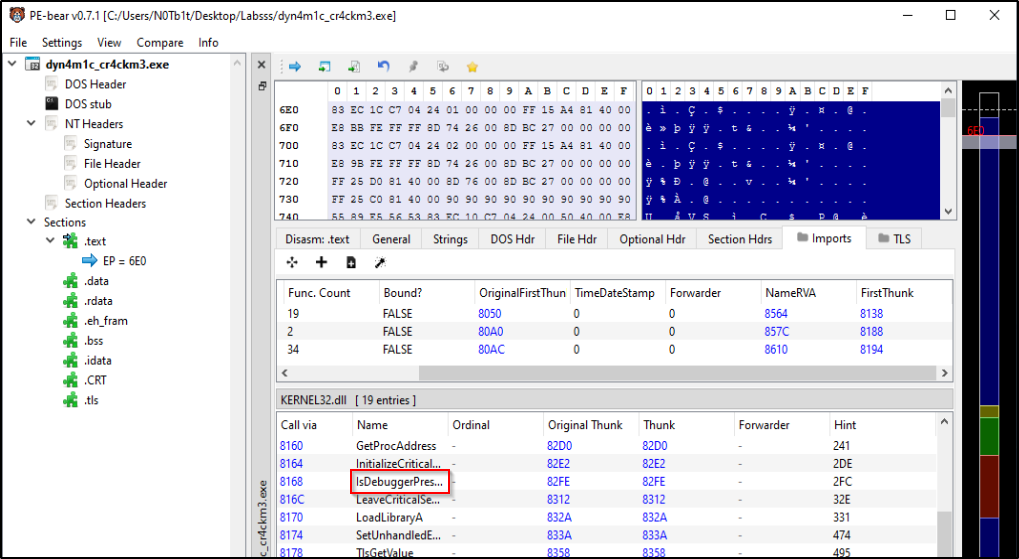 Figure (3)
The IsDebuggerPresent function is a Windows API responsible for detecting whether the program is running inside a debugger. We treat this information as our first pivot point.
2. Debugging Environment Setup (x64dbg Setup)
We now load the program into x64dbg. Since the program requires an argument to be passed at launch, we must inform the debugger accordingly:
- From the top menu, click
File->Change Command Line. - Append a test word after the program path, for example
test_key.
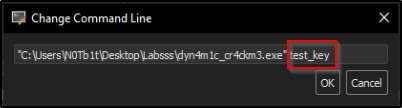 Figure (4)
- Click
OK, then press the shortcutCtrl + F2to restart the program and apply the command line.
We then press F9 (Run) to let the program execute the initial system routines until it halts at the program’s main entry point (Entry Point), where the program name will appear in the comments.
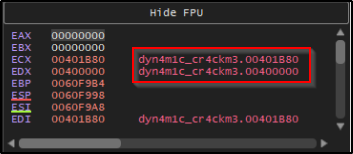 Figure (5)
3. Bypassing Anti-Debugging
We now seek to locate the point where the program checks for the presence of a debugger in order to neutralize it.
- Right-click inside the CPU window (code view).
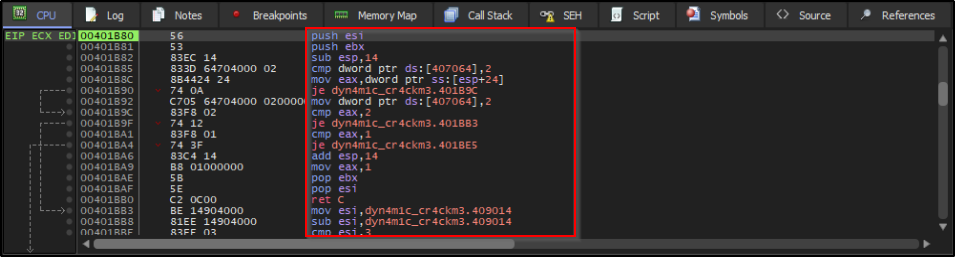 Figure (6)
Select:
Search for->Current Module->String References.In the strings window that appears, search for the
Debugger detectedmessage and double-click it to navigate to its location in the code.
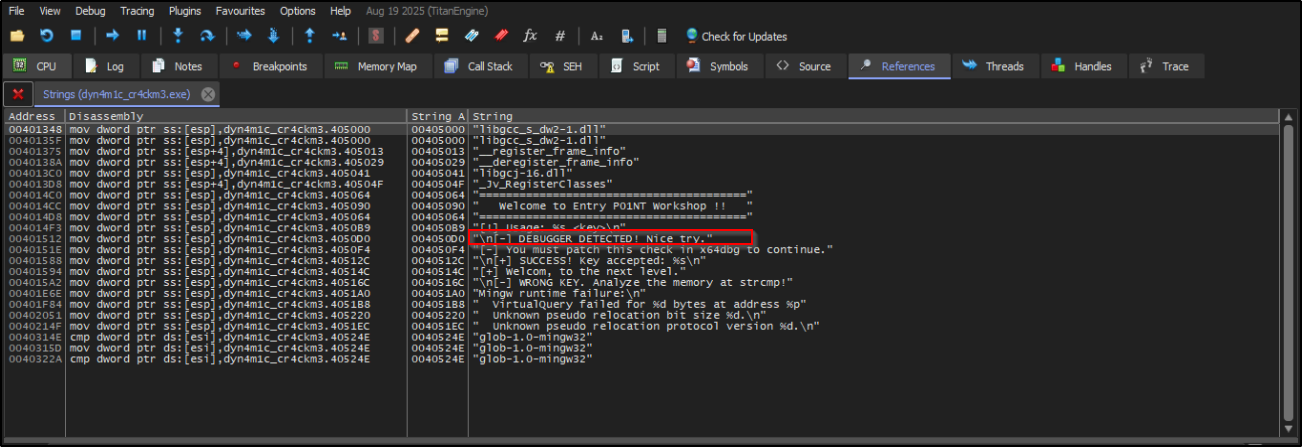 Figure (7)
If we examine the instructions preceding this message, we observe a call to the IsDebuggerPresent function, immediately followed by a test of the result to determine whether we are operating under a debugger, and subsequently a conditional jump (je - Jump if Equal).
Patching Operation: We will now manipulate this conditional jump to invert the logic entirely.
- Single-click on the
jeinstruction, then press theSpace(spacebar) key to open the Edit Instruction window.
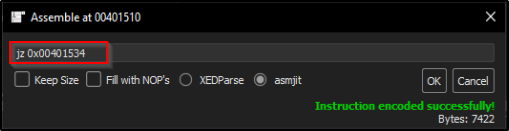 Figure (8)
- Change the instruction from
je(jump if equal) tojne(jump if not equal).
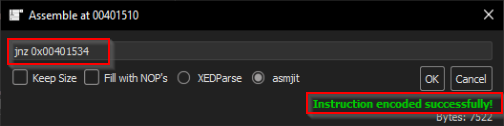 Figure (9)
We confirm the appearance of the message Instruction encoded successfully at the bottom, indicating that the modification was successfully applied in memory. With this, we have effectively blinded the program, and it will no longer detect that we are analyzing it!
4. Analysis of the Validation Routine and Final Patching (The Core Logic)
We return to the strings window (String References) once again. This time, we search for the success message and navigate to it.
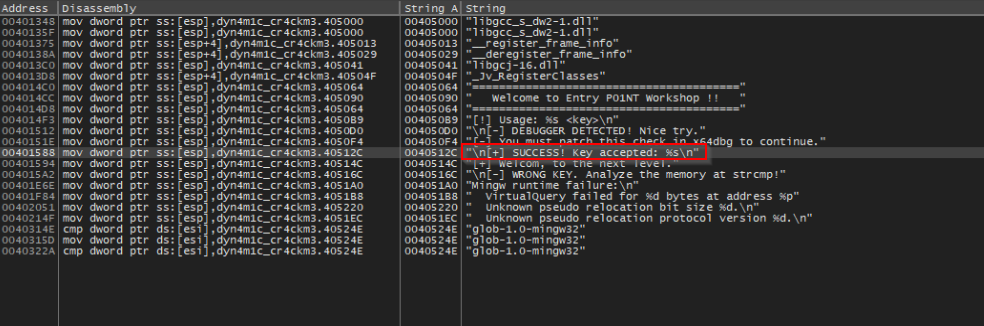 Figure (10)
Examining the code preceding the success message, we observe a call to the strcmp function (the well-known routine that compares two strings: the original key and the key we supplied).
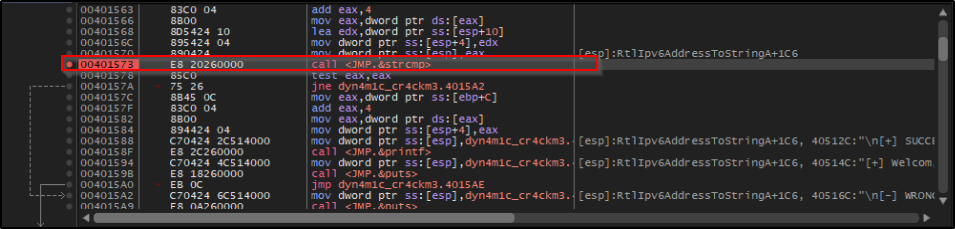 Figure (11)
We click on the call instruction for strcmp and press F2 to set a breakpoint at it (the address will turn red).
We now press F9 (Run) one or more times until program execution reaches this breakpoint.
Note: The program will successfully bypass the debugger check thanks to our earlier modification, which can be observed in the CMD window accompanying x64dbg.
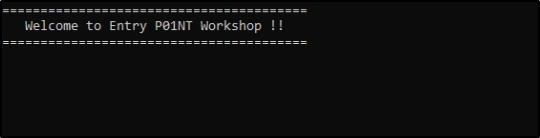 Figure (12)
Leaking the Key
Immediately before the strcmp call is executed, if we examine the registers window or the stack, we will see that two values were passed to the function:
- The test key we entered (
test_key). - The correct original key stored in memory!
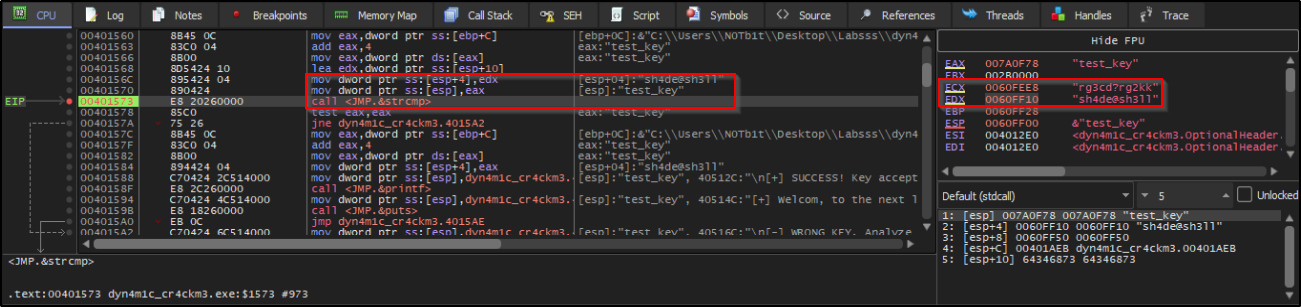 Figure (13)
Modifying the Jump Logic (Forcing Success)
We now press F8 (Step Over) to execute and skip the comparison function. Immediately after the comparison function, we find a test eax, eax instruction followed by a conditional jump jne (which would jump to the failure message because our key is incorrect).
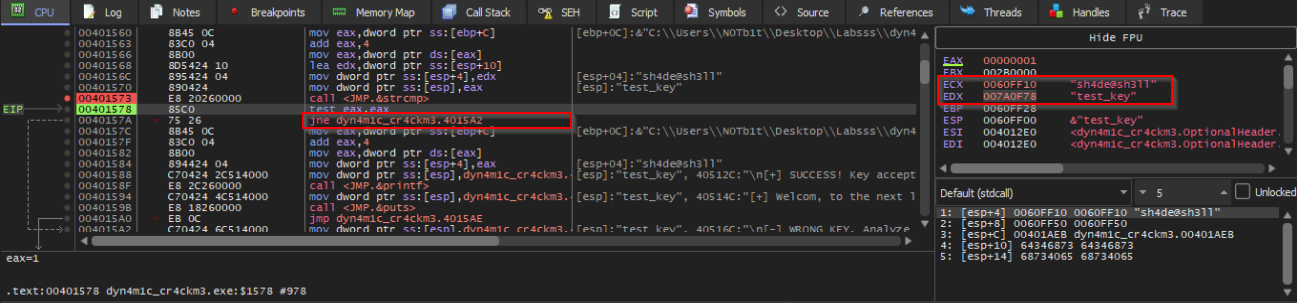 Figure (14)
We perform another patch here: click on jne and press Space, then change it to je. We press F8 to continue. We observe that the Zero Flag (ZF) equals zero, and because we changed the instruction to je, the program will not take the failure jump; instead it falls through to the success message.
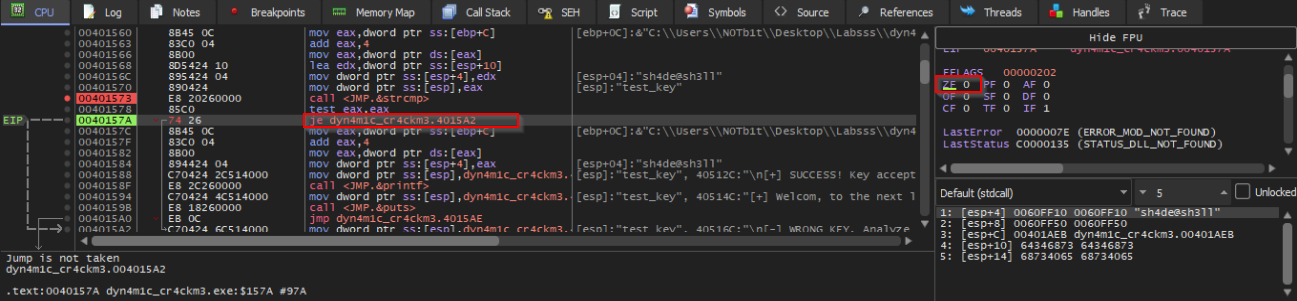 Figure (15)
We continue pressing F8 until we reach the memset call or the end of the procedure.
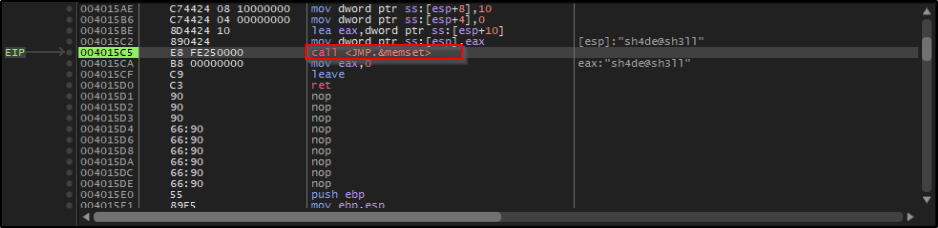 Figure (16)
If we take a look at the CMD window now:
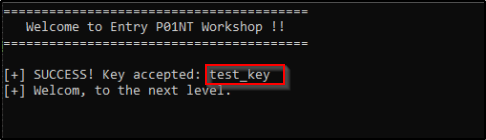 Figure (17)
We have now successfully applied the concept of patching, because the program displayed the “success” message despite the fact that the key we entered (test_key) was incorrect!
5. Confirming the Original Key
If we wish to verify our work without patching, we can take the original key we discovered in memory during the analysis prior to the strcmp call, and run the program normally from the CMD while passing this key to it.
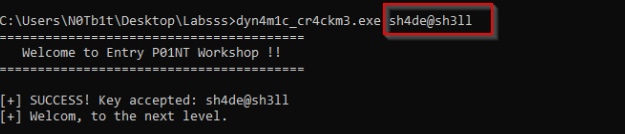 Figure (18)
Congratulations! You have just reverse engineered a program, bypassed its anti-debugging protection, modified its program logic, and successfully extracted the secret key.